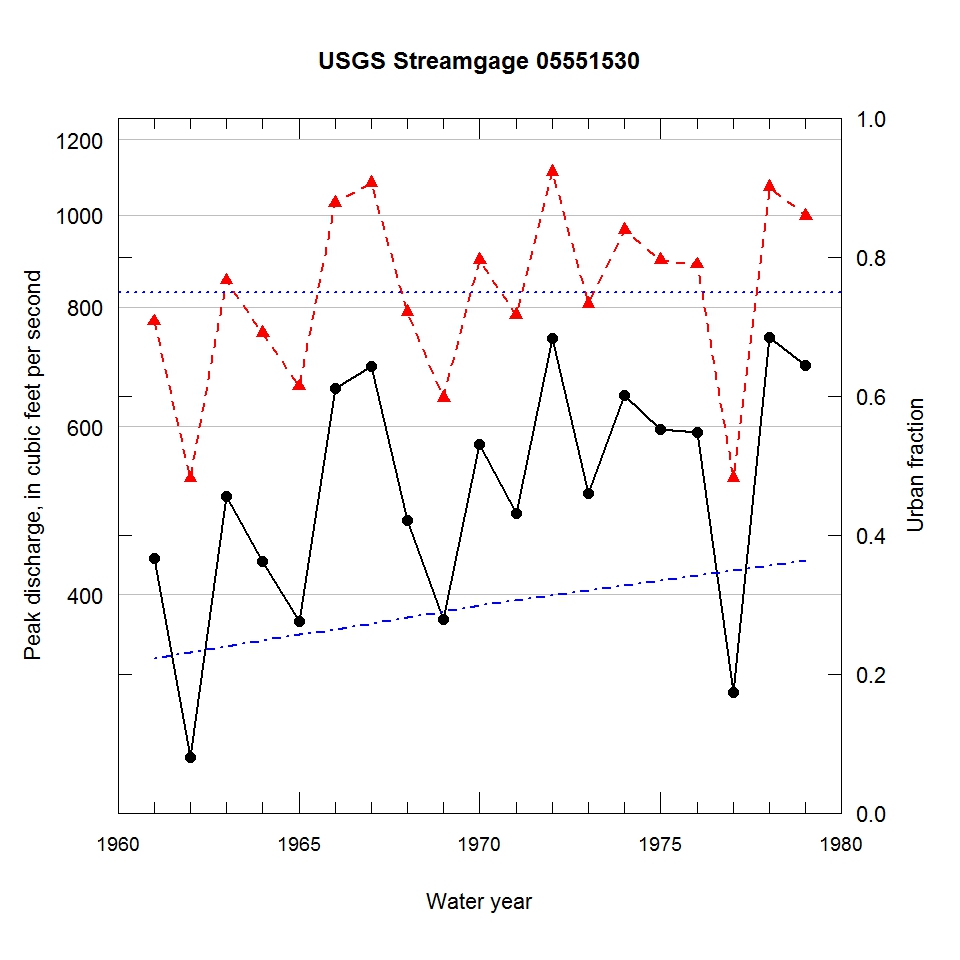
Observed and urbanization-adjusted annual maximum peak discharge and associated urban fraction and precipitation values at USGS streamgage:
05551530 INDIAN CREEK AT AURORA, IL


| Water year | Segment | Discharge code | Cumulative reservoir storage (acre-feet) | Urban fraction | Precipitation (inches) | Observed peak discharge (ft3/s) | Adjusted peak discharge (ft3/s) | Exceedance probability |
| 1961 | 1 | -- | 0 | 0.223 | 1.760 | 436 | 773 | 0.420 |
| 1962 | 1 | -- | 0 | 0.231 | 0.393 | 270 | 529 | 0.752 |
| 1963 | 1 | -- | 0 | 0.239 | 1.981 | 507 | 854 | 0.324 |
| 1964 | 1 | -- | 0 | 0.248 | 2.871 | 433 | 752 | 0.446 |
| 1965 | 1 | -- | 0 | 0.256 | 0.140 | 375 | 661 | 0.566 |
| 1966 | 1 | -- | 0 | 0.265 | 2.477 | 658 | 1030 | 0.180 |
| 1967 | 1 | -- | 0 | 0.273 | 2.720 | 694 | 1080 | 0.161 |
| 1968 | 1 | -- | 0 | 0.282 | 1.393 | 478 | 791 | 0.398 |
| 1969 | 1 | -- | 0 | 0.290 | 2.127 | 377 | 643 | 0.592 |
| 1970 | 1 | -- | 0 | 0.299 | 1.588 | 575 | 897 | 0.278 |
| 1971 | 1 | -- | 0 | 0.306 | 0.163 | 486 | 785 | 0.406 |
| 1972 | 1 | -- | 0 | 0.313 | 6.785 | 742 | 1110 | 0.148 |
| 1973 | 1 | -- | 0 | 0.320 | 1.347 | 511 | 807 | 0.380 |
| 1974 | 1 | -- | 0 | 0.327 | 1.434 | 647 | 964 | 0.219 |
| 1975 | 1 | -- | 0 | 0.335 | 1.933 | 596 | 897 | 0.277 |
| 1976 | 1 | -- | 0 | 0.342 | 0.005 | 592 | 887 | 0.287 |
| 1977 | 1 | -- | 0 | 0.349 | 0.658 | 316 | 530 | 0.749 |
| 1978 | 1 | -- | 0 | 0.356 | 5.819 | 744 | 1070 | 0.165 |
| 1979 | 1 | -- | 0 | 0.363 | 0.527 | 696 | 998 | 0.196 |

